Dan Mandle | SVP, Data Science and Analytics
Nick Kang | Analytics Coordinator
The USDA’s quintennial Census of Agriculture is currently under way and due to be published in early 2024. The Engage team at broadhead regularly accesses results from past Census waves, recently digging into National Agricultural Statistics Service (NASS) data to answer questions about the changing demographic of farmers.
Agrimarketers have known for years that farm businesses are run by an audience who skews older. We’ve also kept up with various consolidations that are leading to fewer — but larger — farms.
What we wanted to find out was what the data suggested might be happening at the focal point of these two changes: What could we learn about farm size in relation to the age of those farming the land?
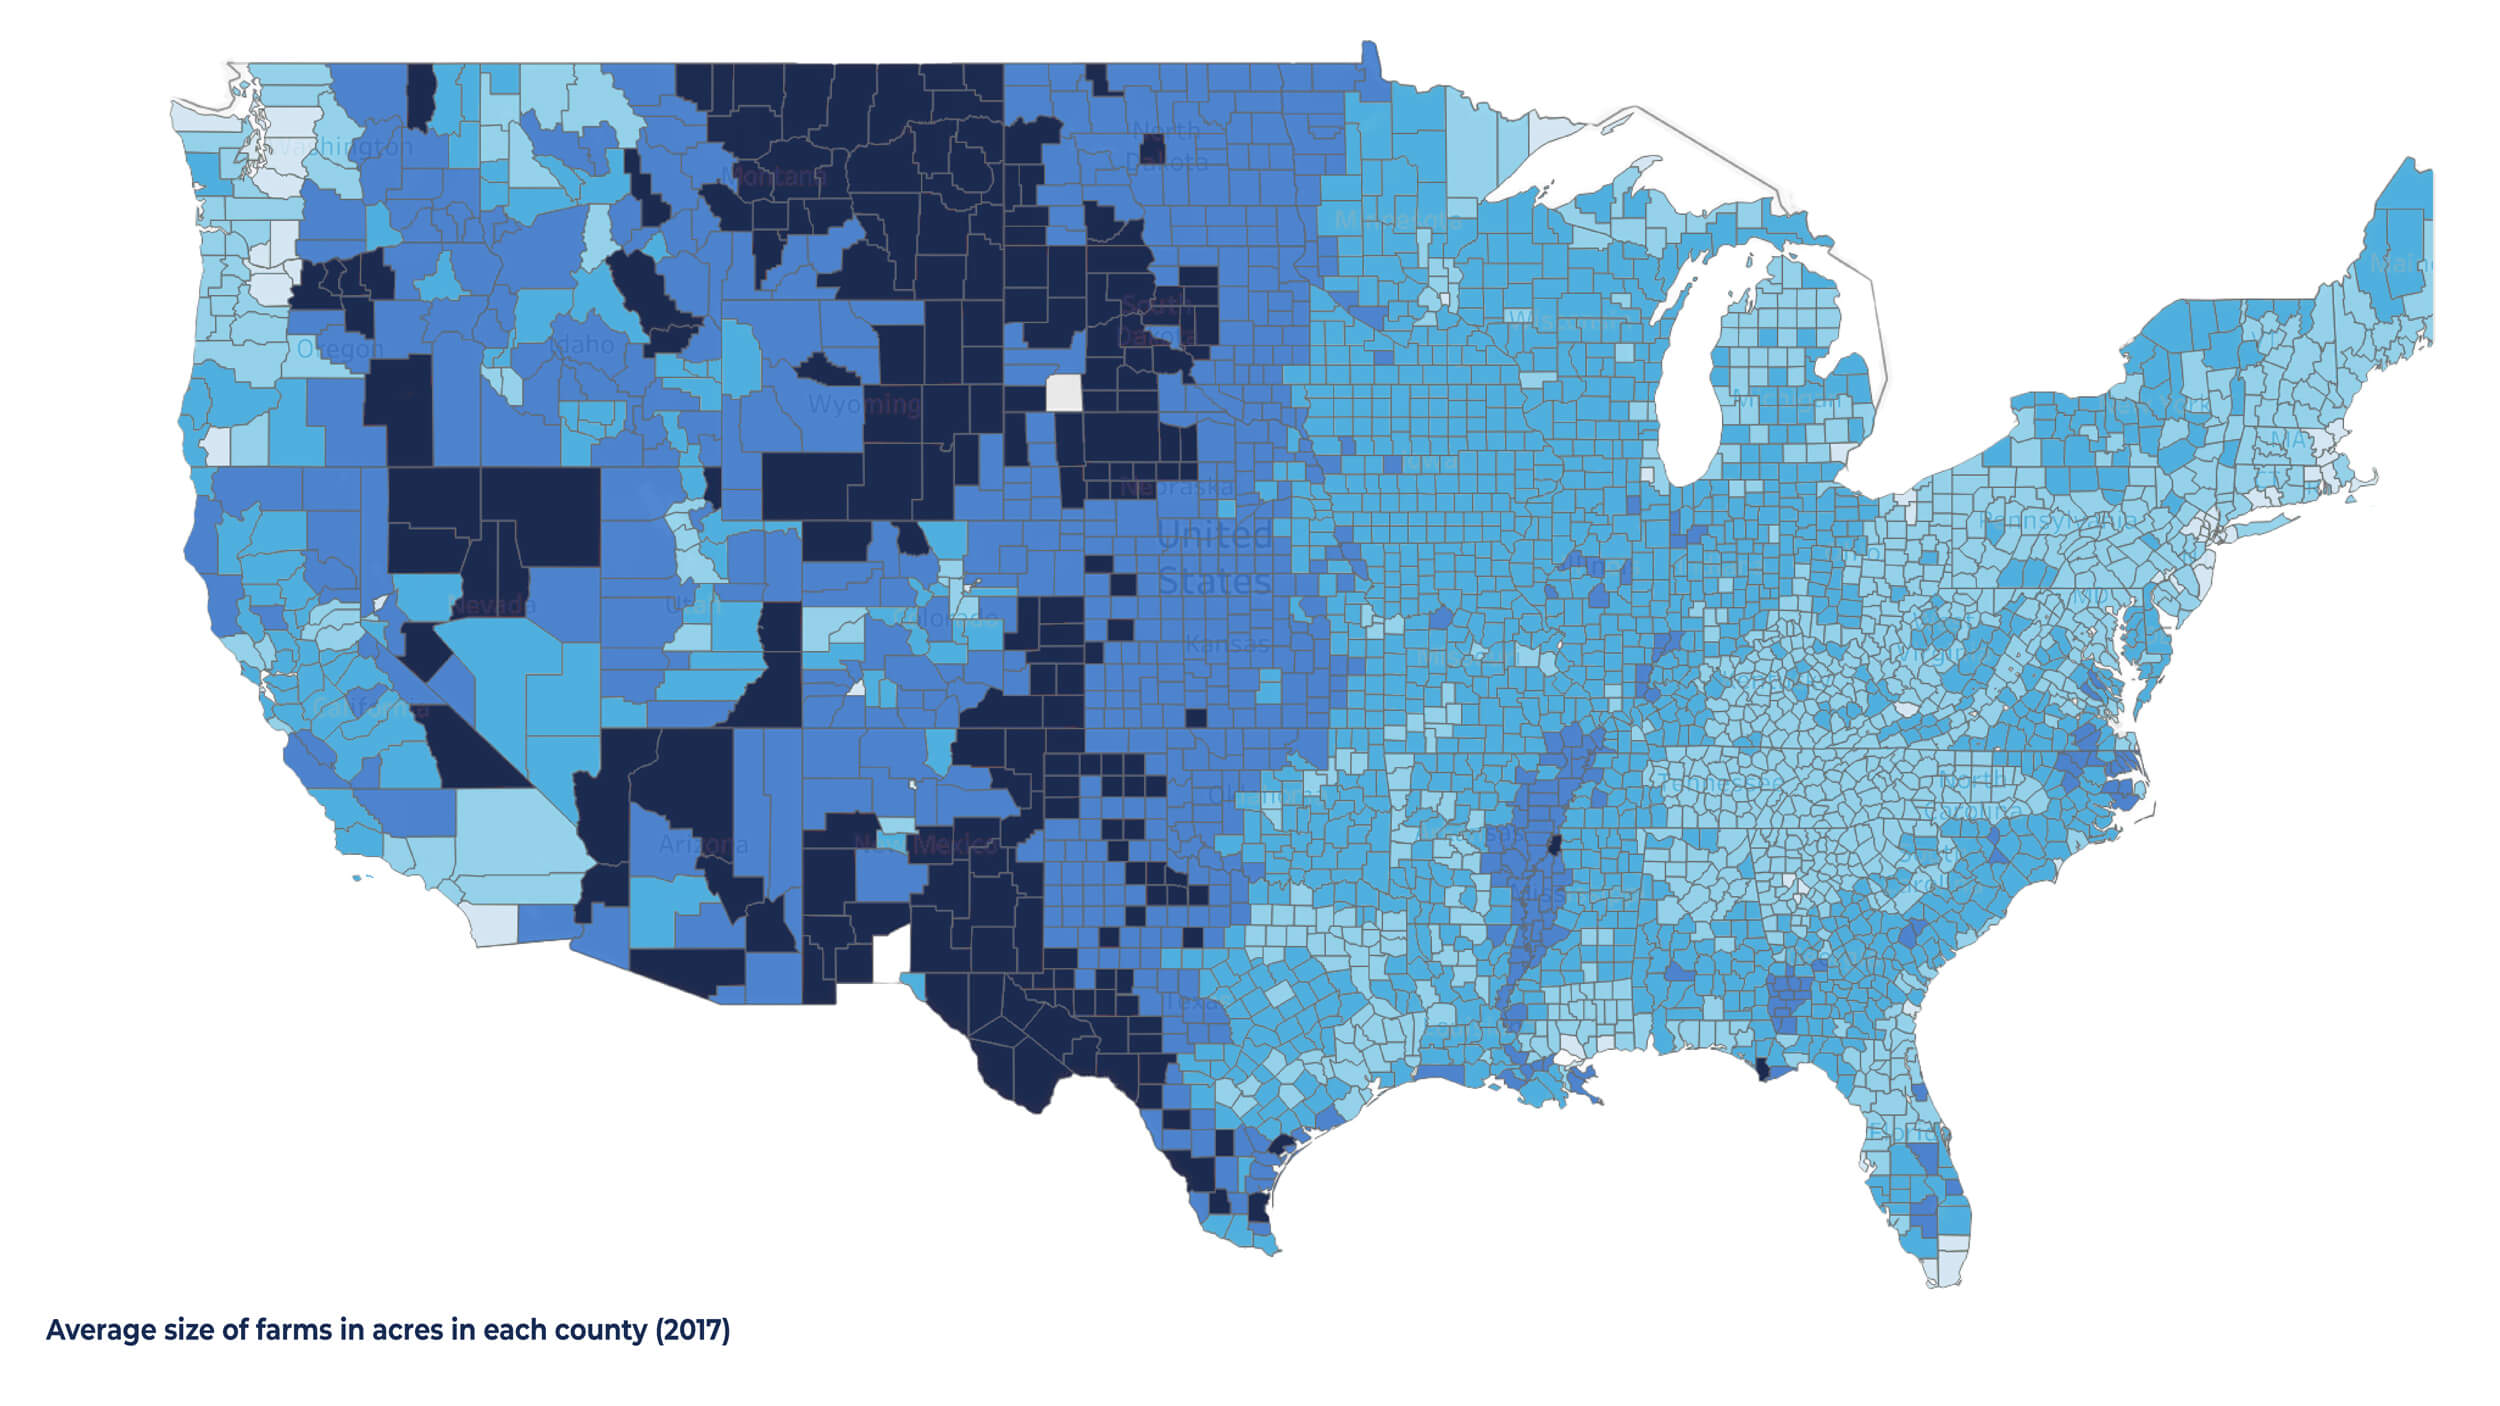
First, we sought out the NASS datasets that would show us which counties in the United States were home to the largest farms (by acre). We found a clear band of farms ranging in size from 500-2000+ acres, running from Montana through the Dakotas, down Colorado through western Kansas, into New Mexico and western Texas. Note the sizable blip in northern Nevada.
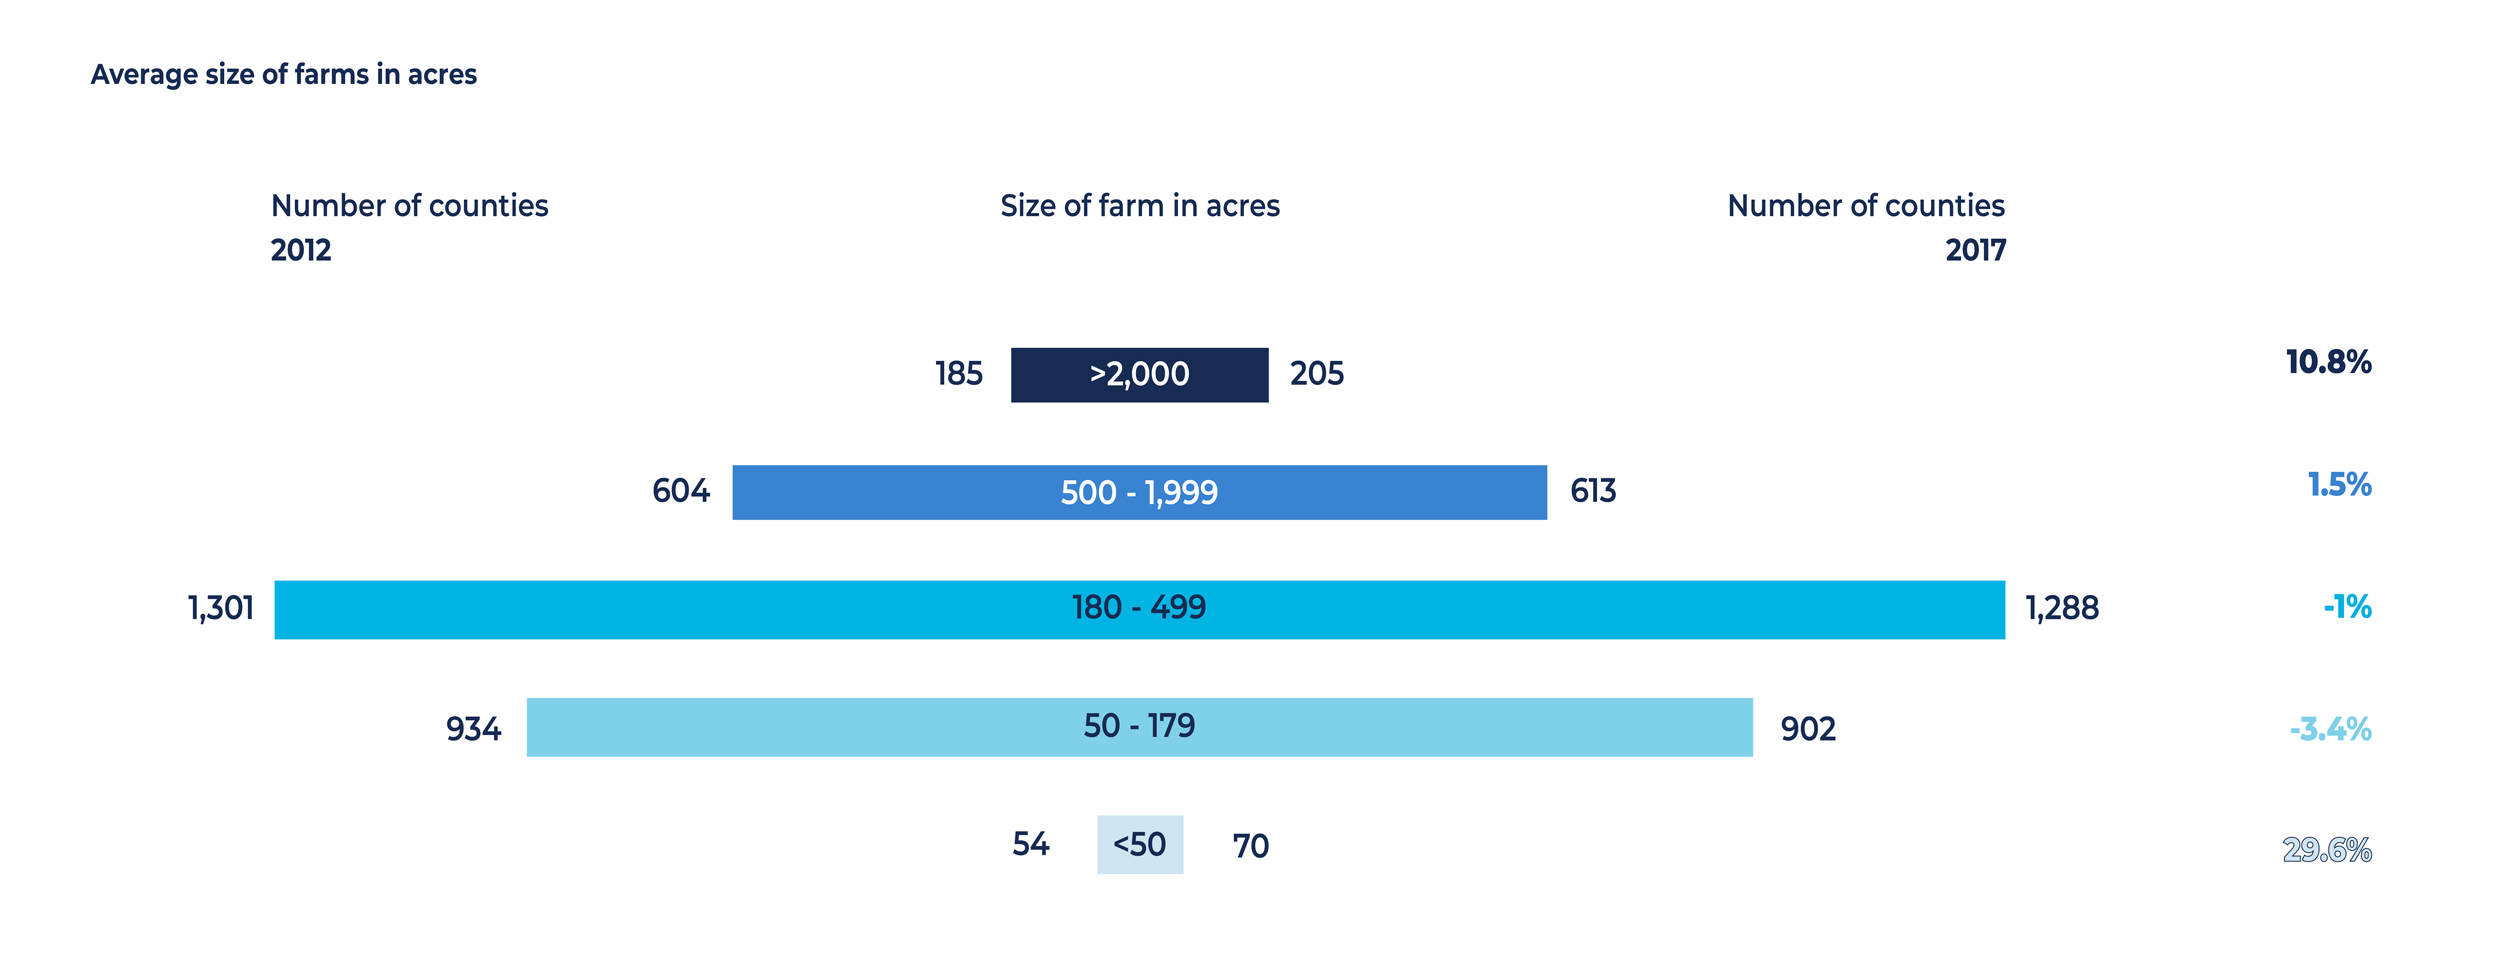
While counties with mid-sized farms (180-1999 acres) made up a majority (62%) of the farming community in 2017 — 91% if we also account for farms in the 50-179 acre range — counties with farms of either the largest or smallest variety (2000+ acres and <50 acres, respectively) increased the most from 2012 to 2017.
We replicated this approach to the data when it came time to determine the average age of farmers by county. As suggested up top, what we found was not surprising: 65% of farmers were at least 55 years of age, whereas farmers under 54 years of age amounted to just 35% of all counties’ producer population.
What became interesting, though, was what happened when we parsed the data over time to see a picture of the demographic trend: the number of counties with older producer residents may outnumber those with the younger segment. However, from the Ag Census in 2012 to the one in 2017 there was a clear trend in the average age of farmers: the number of counties with younger farmers grew.
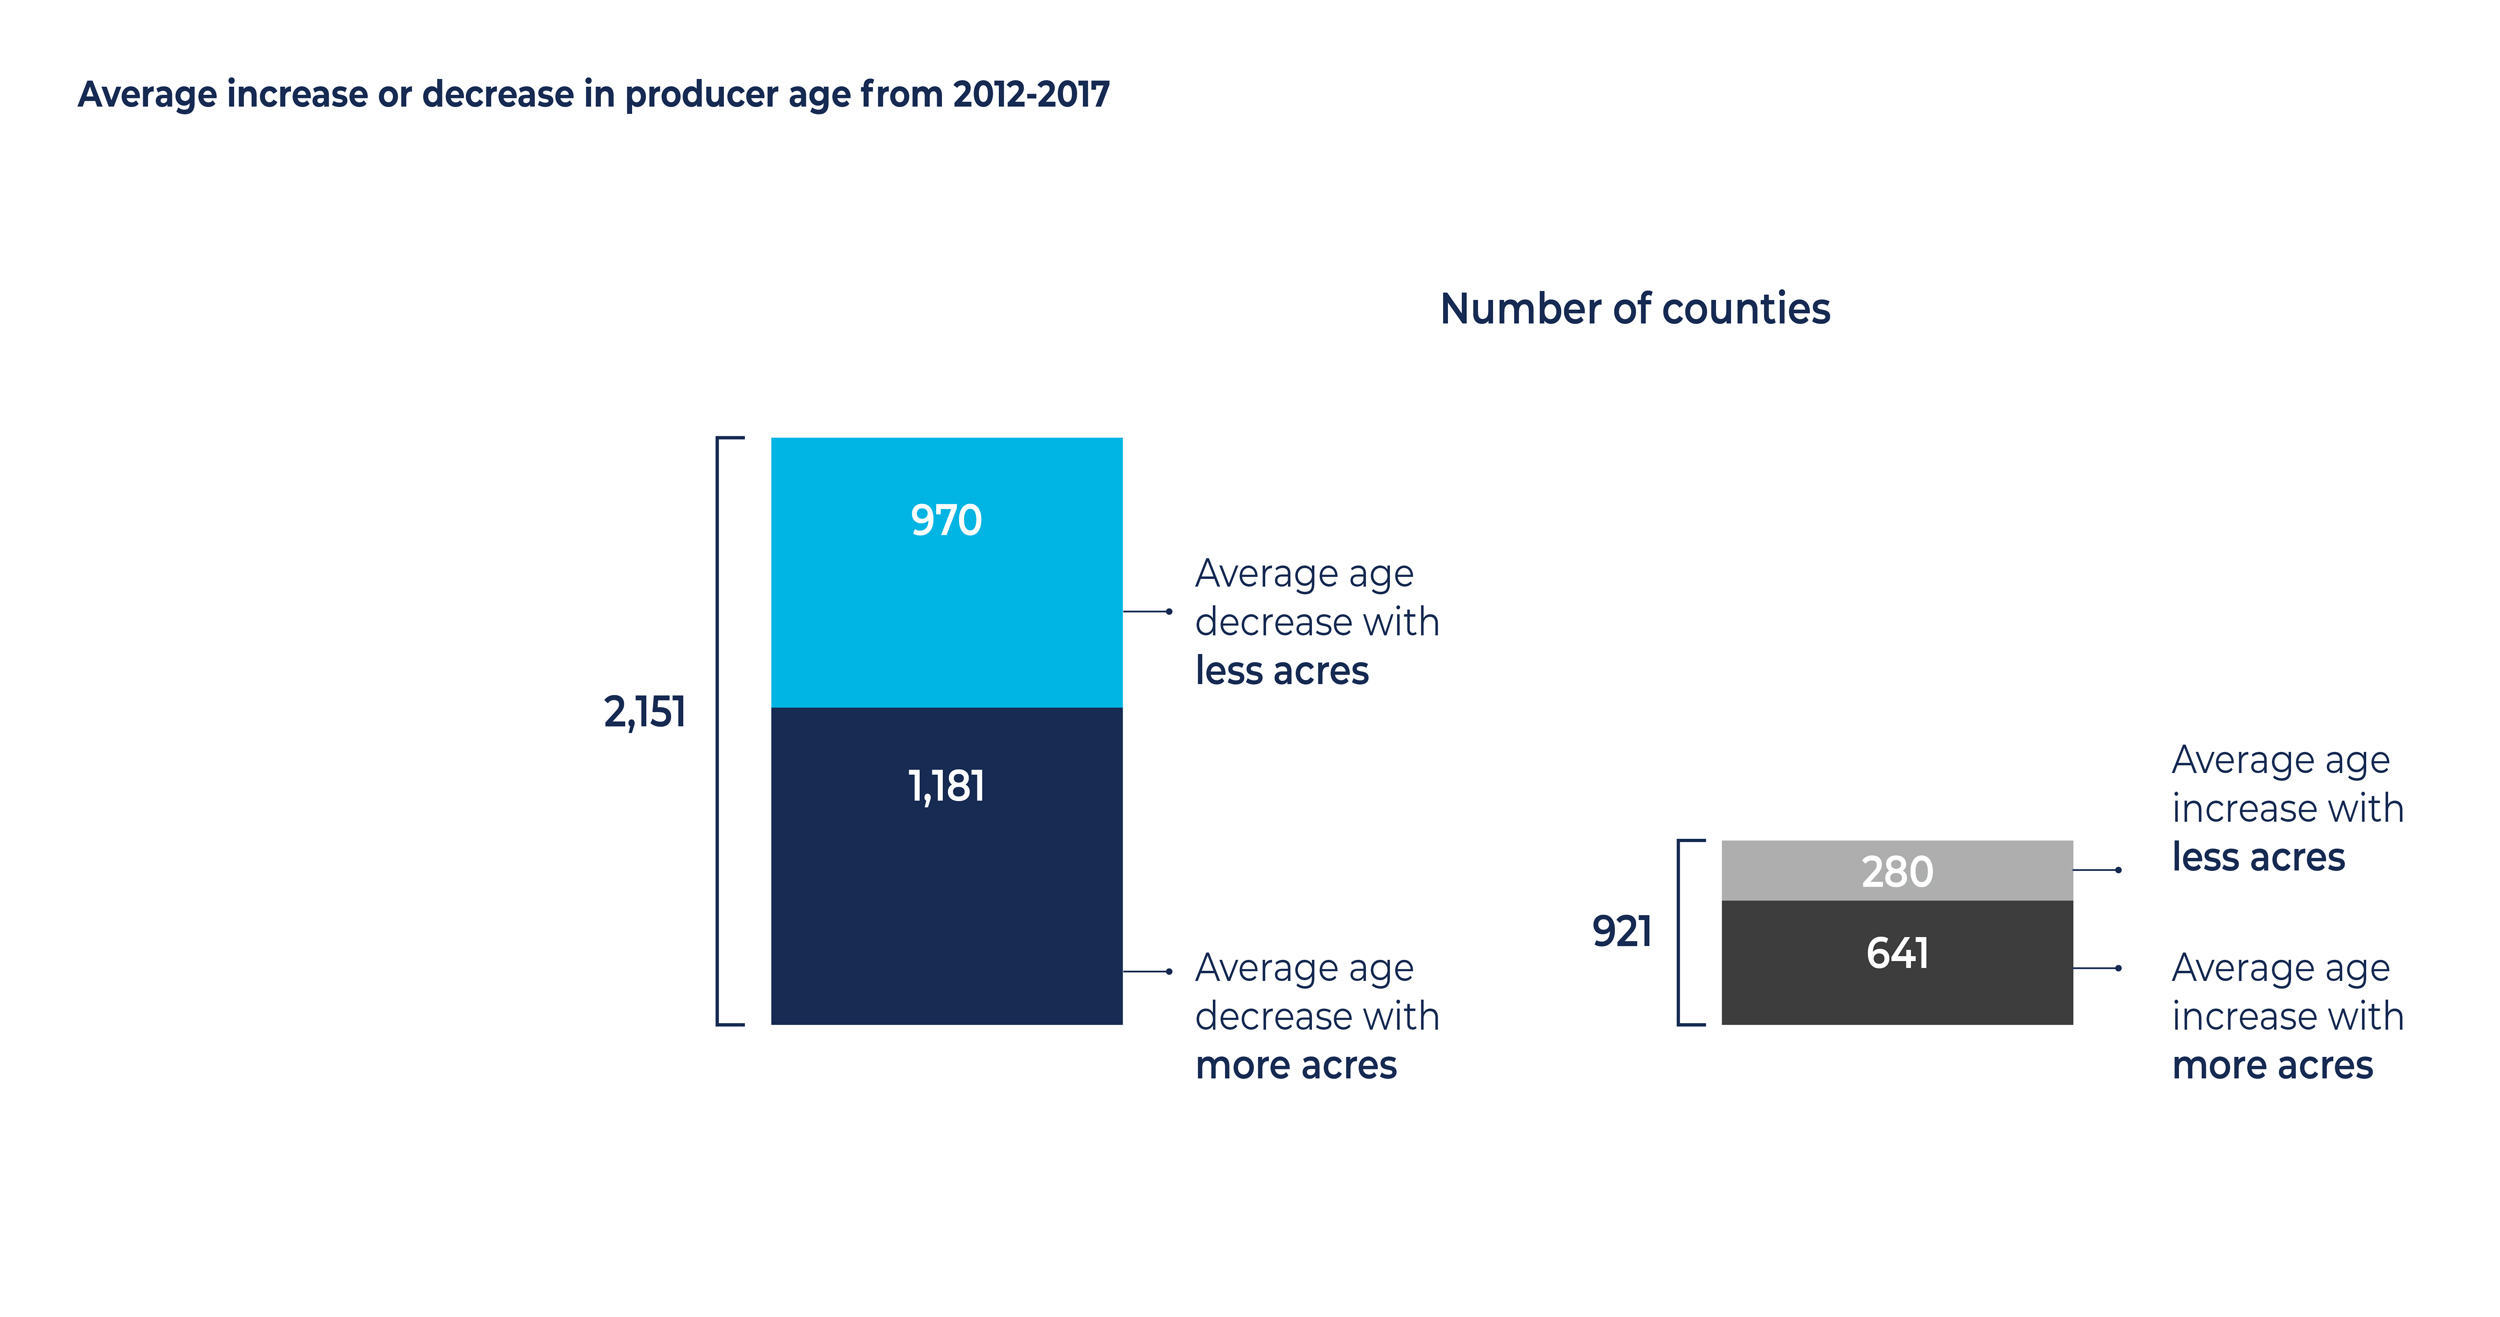
Furthermore, when we laid average farm acreage atop those two sets of counties, we saw that same story — more counties with a younger average producer age — but also those younger counties are also increasing their farm acreage!
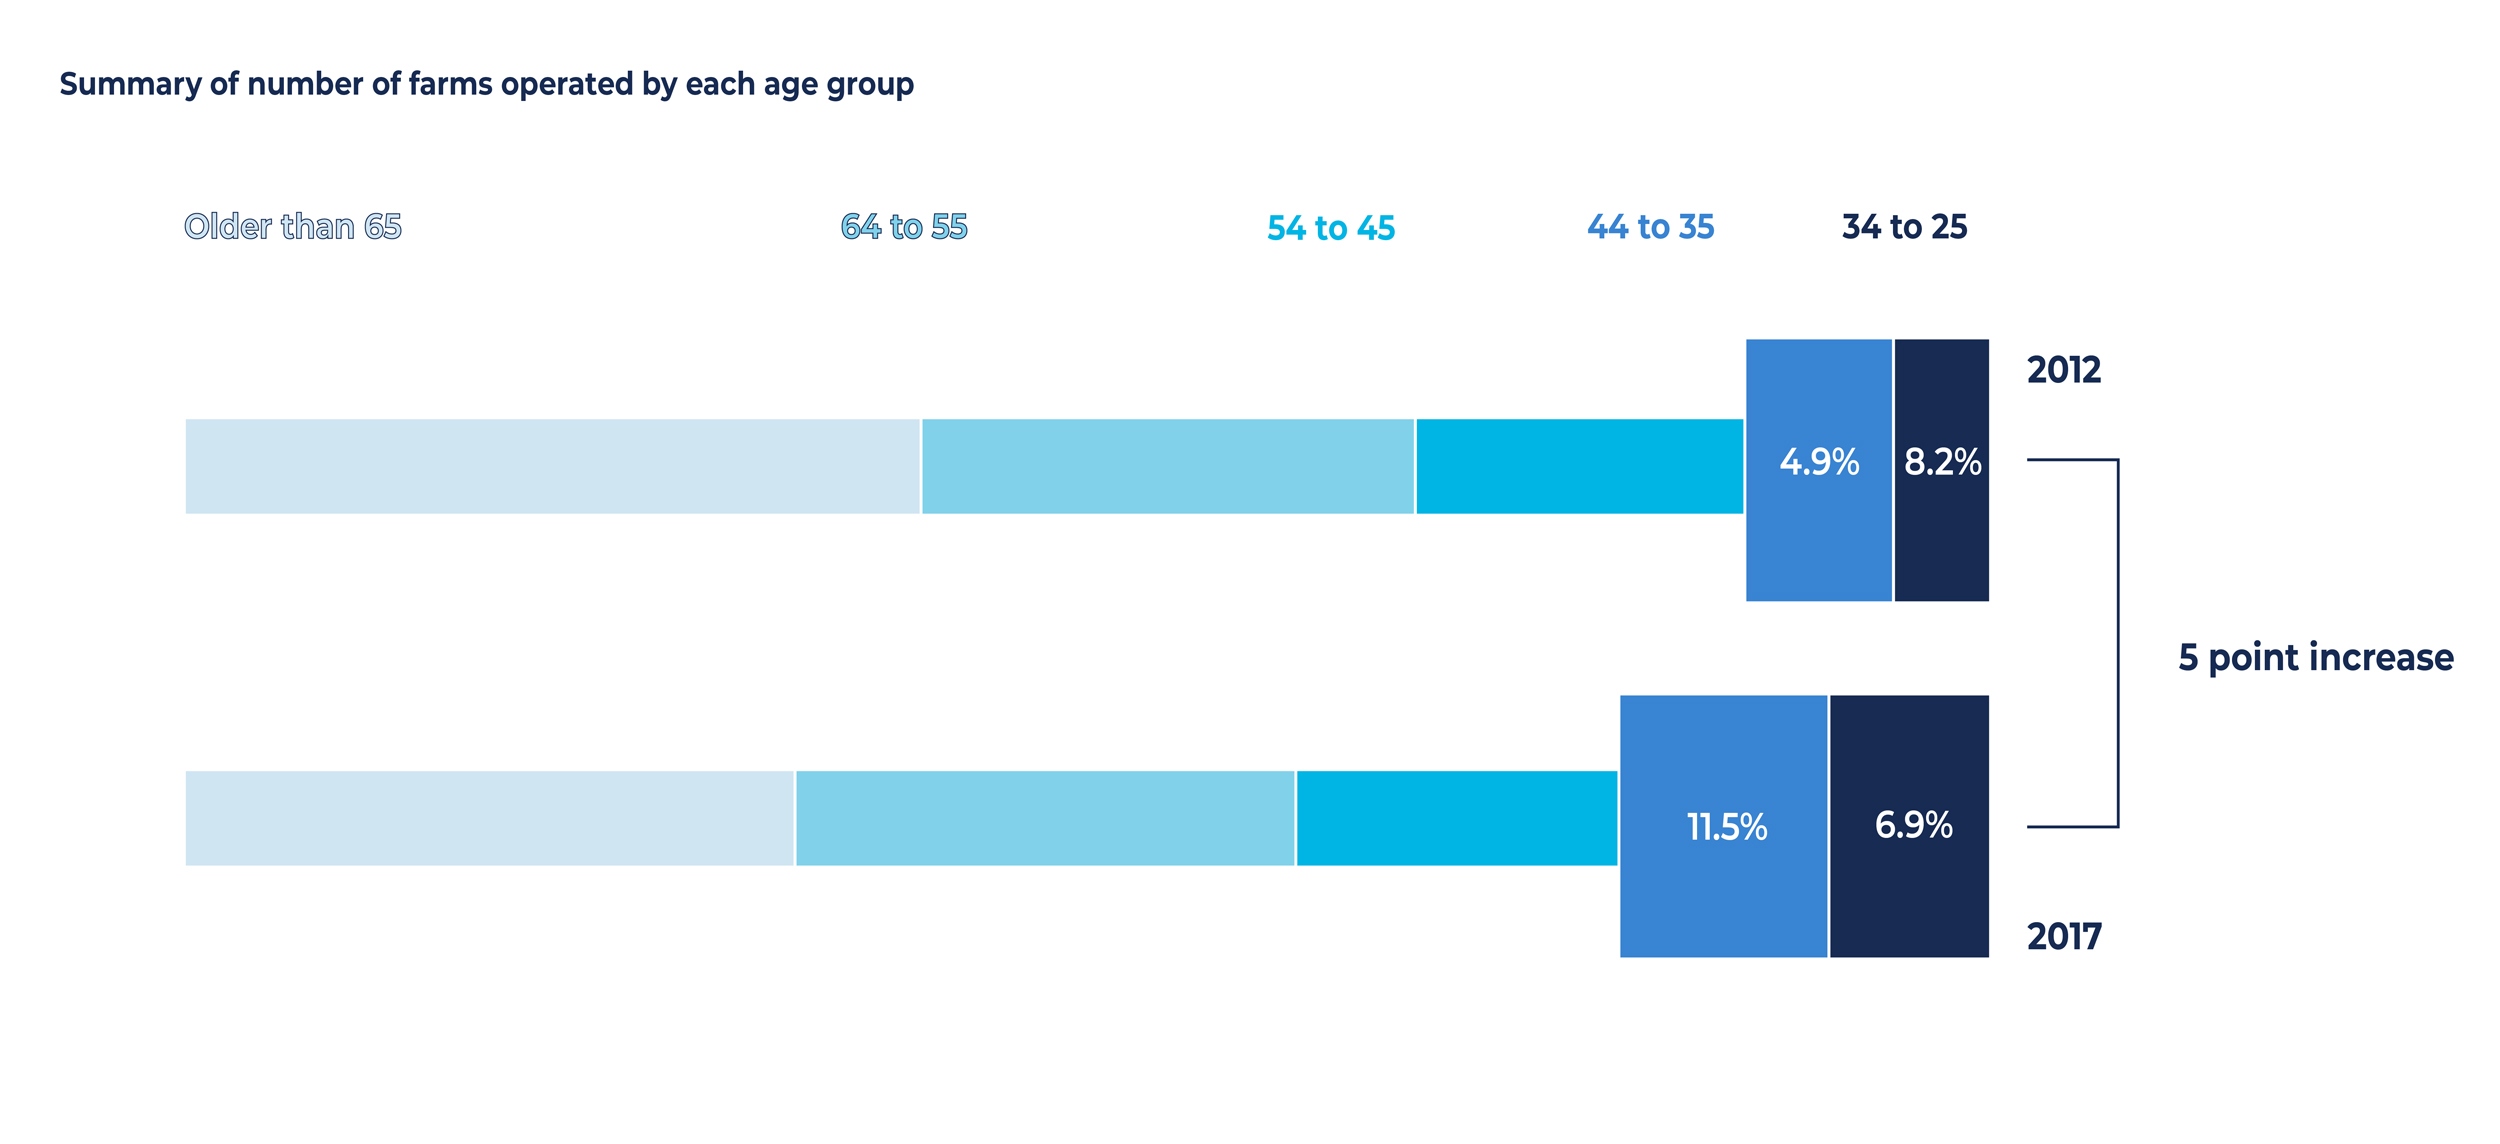
The final piece of the exploratory puzzle was to determine what the younger farmers and larger-acreage-per-younger-producer might mean in terms of the number of farms owned by each age group. For this analysis we expanded the time period to include a whole ten years — for three waves of Ag Census results. Counties aren’t only seeing the average age of their farmers decline, and the acres farmed by those younger farmers increase. They are also seeing those younger farmers owning more farms: The share of farms owned by 25–44-year-old farmers went up by five percentage points over the past five years.
It’s tempting to take these data from the USDA/NASS Ag Census waves and try to make projections—e.g., within a little more than one generation, farm operation among the 65+ age group could shrink down to levels seen today for the 45-54 age group. The ramifications for marketing would be enormous. But so, too, the risks of extrapolating too much from just a few waves of the Census.
At the very least, we can be assured that the Ag Census seems to corroborate other stories detailing the pick-up in farm succession planning. It also suggests that the younger farmers have bigger footprints than their more seasoned counterparts.
Curious what these numbers mean specific to your organization and market segments? Connect with us to get started.